Titan
Wikipedia #
https://en.wikipedia.org/wiki/Titan_(moon)
Maps #
Quadrangles #
Titan’s quadrangles haven’t been defined at the time of writing. We can assume that they should be named “St” can be inferred from the other jovian and saturnian moons such as Europa (Je), Ganymede (Jg), Enceladus (Se)… So Titan should be St.
Regarding the quadrangles definition, I overlapped the traditional division into 15 quadrangles of the Jovian moons (and other moons/small planets) found here: https://ntrs.nasa.gov/api/citations/19930001644/downloads/19930001644.pdf ( backup ) with a map of the main albedo features known to date.
https://photojournal.jpl.nasa.gov/catalog/PIA20713
This map of Titan shows the names of many (but not all) features on the Saturnian moon that have been approved by the International Astronomical Union. The map shows Cassini imaging coverage of Titan as of June 2015 (previously published as PIA19658).
https://photojournal.jpl.nasa.gov/catalog/PIA19657
The northern and southern hemispheres of Titan are seen in these polar stereographic maps, assembled in 2015 using the best-available images of the giant Saturnian moon from NASA’s Cassini mission. The images were taken by Cassini’s imaging cameras using a spectral filter centered at 938 nanometers, allowing researchers to examine variations in albedo (or inherent brightness) across the surface of Titan. These maps utilize imaging data collected through Cassini’s flyby on April 7, 2014, known as “T100.”
Titan’s north pole was not well illuminated early in Cassini’s mission, because it was winter in the northern hemisphere when the spacecraft arrived at Saturn. Cassini has been better able to observe northern latitudes in more recent years due to seasonal changes in solar illumination. Compared to the previous version of Cassini’s north polar map (see PIA11146), this map provides much more detail and fills in a large area of missing data. The imaging data in these maps complement Cassini synthetic aperture radar (SAR) mapping of Titan’s north pole (see PIA17655).
The uniform gray area in the northern hemisphere indicates a gap in the imaging coverage of Titan’s surface, to date. The missing data will be imaged by Cassini during flybys on December 15, 2016 and March 5, 2017.
Lakes are also seen in the southern hemisphere map, but they are much less common than in the north polar region. Only a lakes have been confirmed in the south. The dark, footprint-shaped feature at 180 degrees west is Ontario Lacus; a smaller lake named Crveno Lacus can be seen as a very dark spot just above Ontario. The dark-albedo area seen at the top of the southern hemisphere map (at 0 degrees west) is an area called Mezzoramia.
Each map is centered on one of the poles, and surface coverage extends southward to 60 degrees latitude. Grid lines indicate latitude in 10-degree increments and longitude in 30-degree increments. The scale in the full-size versions of these maps is 4,600 feet (1,400 meters) per pixel. The mean radius of Titan used for projection of these maps is 1,600 miles (2,575 kilometers).
So for example the North Pole is clearly in St-01, while features like Adiri is split between St-09 and St-08. Regaridng the names, St-08’s main feature is the dark patch Belet, St-09 contains primarily Shangri-La, so the names could be picked easily. However, St-01 contains three “seas”: Kraken, Ligeia and Punga. Kraken is the biggest, but its center is technically outside of the St-01 quadrangle (located at 68°N, while St-01 ends at 66°N), so the next reasonable choice is Ligeia.
Summary:
-
St-01 Ligeia: 180-65°N, 0-360°E
-
St-08 Belet: 22°N-22°S, 288-216°E
-
St-09 Shangri-la: 22°N-22°S, 216-144°E
Sky #
Brightness #
The high Titan atmosphere is opaque to visible light. Therefore, the sky of Titan is constantly covered by what looks like a cover of thick clouds and the brightness, even during daytime, is quite similar to what one would see during a storm or indoors.
Article: https://iopscience.iop.org/article/10.3847/1538-3881/aae519 ( Backup )
“Sky brightness and viewing conditions are expected to be quite different from Earth and Mars due to Titan’s farther distance from the Sun ( 10 AU) and complex haze layers in its atmosphere. The sky brightness model videos show what a typical sunny day may look like standing on the surface of Titan based on radiative transfer models.
For astronauts who see with visible light, the daytime sky has a distinctly dark orange color and appears uniform in all directions due to significant Mie scattering from the many high-altitude haze layers. The daytime sky is calculated to be 100-1000 times dimmer than an afternoon on Earth, which is similar to the viewing conditions of a thick smog or dense fire smoke. The sunsets on Titan are expected to be “underwhelming events”, where the Sun disappears about half-way up in the sky (50° above the horizon) with no distinct change in color. After that, the sky will slowly darken until it reaches night. However, the surface is expected to remain as bright as the full Moon up to 1 Earth-day after sunset.
For reference on the luminosity levels: https://www.ncbi.nlm.nih.gov/pmc/articles/PMC6656201/
Outdoor light levels were much higher (11,080–18,176 lux) than indoors (112–156 lux). The higher lux levels protective of myopia (>1000 lux) were measured at the tree shade (5556–7876 lux) and with hat (4112–8156 lux). […] illuminance levels reaching 130,000 lux on a clear day to 15,000 lux under shaded or cloudy conditions.
Saturn’s visibility #
From “Saturn’s Moon Titan: From 4. 5 Billion Years Ago to the Present - an Insight Into the Workings and Exploration of the Most Earth-Like World in the Outer Solar System”, Ralph Lorenz https://books.google.pt/books?id=xyNRygEACAAJ&redir_esc=y
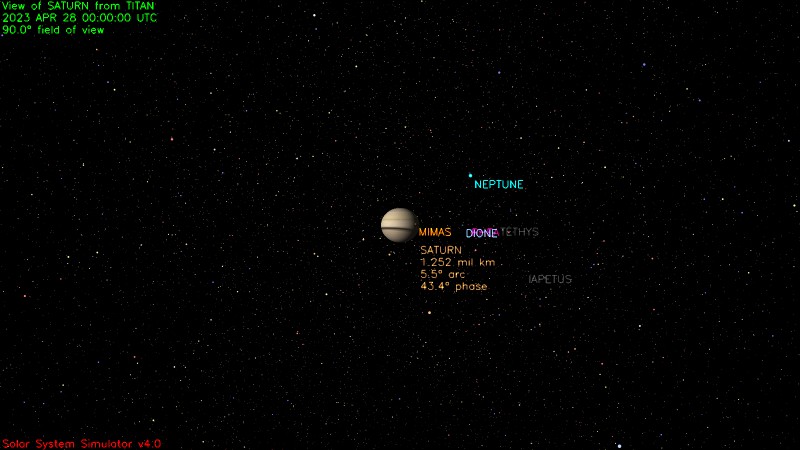
In visible light, Saturn will make the sky on Titan’s Saturn-facing side appear slightly brighter, similar to an overcast night with a full moon on Earth. Saturn’s rings are hidden from view owing to the alignment of Titan’s orbital plane and the plane of the rings. Saturn is expected to show phases, akin to the phases of Venus on Earth, that partially illuminate the surface of Titan at night, except for eclipses.
From NASA’s simulator https://space.jpl.nasa.gov/, 90° aperture:
Magnetosphere #
Titan spends 95% of its time within Saturn’s magnetosphere, which may help shield it from the solar wind.
Titan orbits Saturn once every 15 days and 22 hours.
So 5% should be the time spent exposed to solar wind, which amounts to (0.05 * 16 * 24) = 19h every two weeks.
I find everywhere mentions to the fact that Titan’s surface is not strongly radioactive, but I can’t find references or explanations, so I can’t say whether it’s lack of data or not, whether it’s due to its atmosphere or Saturn’s magnetosphere or whatnot. :(
Atmosphere #
Color #
External layers are dark, UV blue, internal layers are yellow-orange due to the presence of tolines.
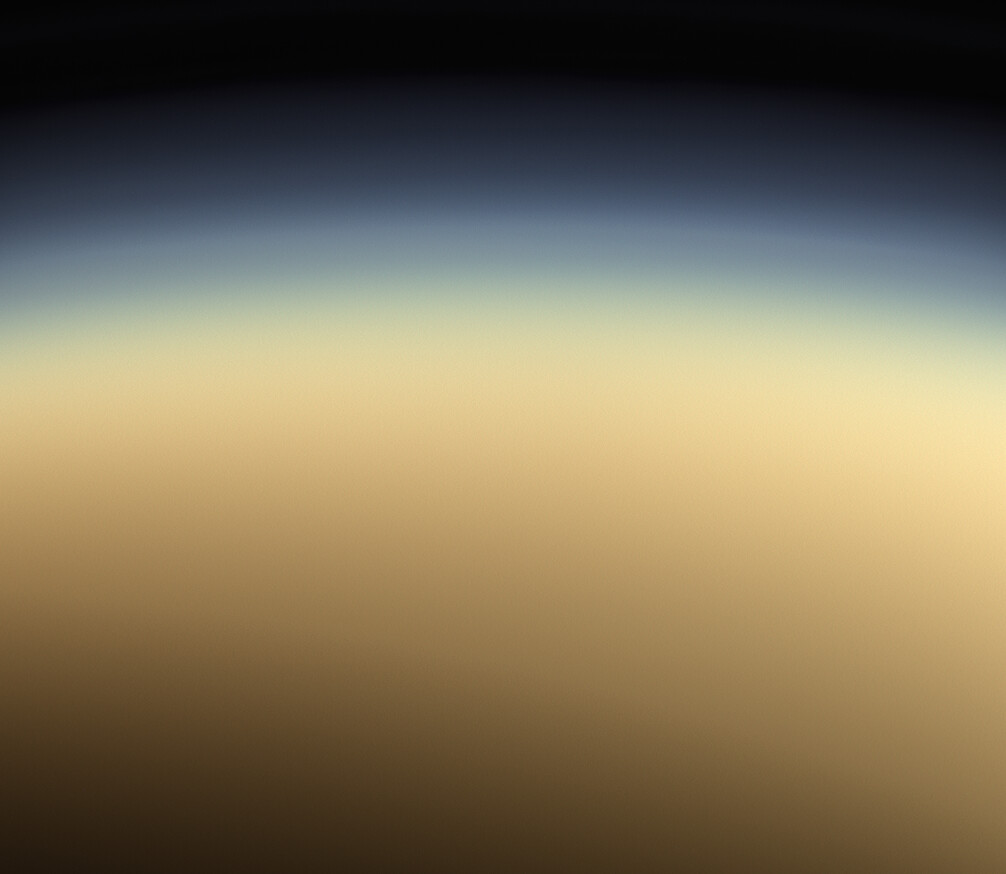
https://www.flickr.com/photos/kevinmgill/50320802233/in/photostream/
Processed using calibrated red, green, and blue filtered images of Titan taken by Cassini on November 19 2007. NASA/JPL-Caltech/SSI/CICLOPS/Kevin M. Gill
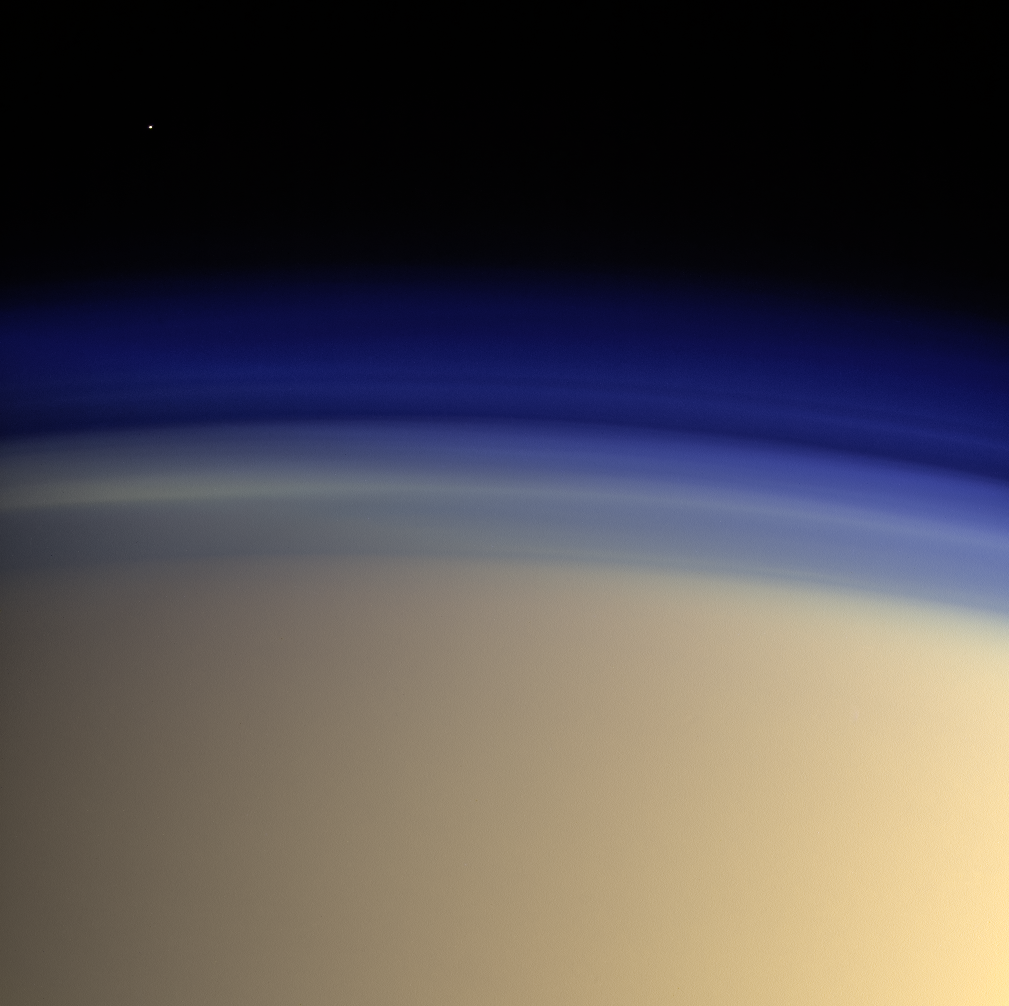
https://www.flickr.com/photos/kevinmgill/50343380682/in/photostream/
Processed using calibrated red, green, blue, and ultraviolet filtered images taken by Cassini on June 18 2014. The blue image is only used on a small part to colorize the star at the top left. The rest of the image uses UV in the blue channel. […] NASA/JPL-Caltech/SSI/CICLOPS/Kevin M. Gill
Weather and Climate #
Titan’s surface temperature is about 94 K (-179.2C). At this temperature, water ice has an extremely low vapor pressure, so the little water vapor present appears limited to the stratosphere. Titan receives about 1% as much sunlight as Earth. Before sunlight reaches the surface, about 90% has been absorbed by the thick atmosphere, leaving only 0.1% of the amount of light Earth receives.
There seem to be clearly a complex weather system on Titan, very similar to Earth’s, with a “methane cycle” similar to the water cycle on Earth. However, is often unclear what pictures are taken in visible light and what in infrared, because due to Titan’s haze opacity to visible light, most images default to infrared without telling.
Clouds #
https://photojournal.jpl.nasa.gov/catalog/PIA18420
This animated sequence of Cassini images shows methane clouds moving above the large methane sea on Saturn’s moon Titan known as Ligeia Mare. The spacecraft captured the views between July 20 and July 22, 2014, as it departed Titan following a flyby. Cassini tracked the system of clouds as it developed and dissipated over Ligeia Mare during this two-day period. Measurements of the cloud motions indicate wind speeds of around 7 to 10 miles per hour (3 to 4.5 meters per second).
The timing between exposures in the sequence varies. In particular, there is a 17.5-hour jump between the second and third frames. Most other frames are separated by one to two hours. A separate view, PIA18421, shows the location of these clouds relative to features in Titan’s north polar region.
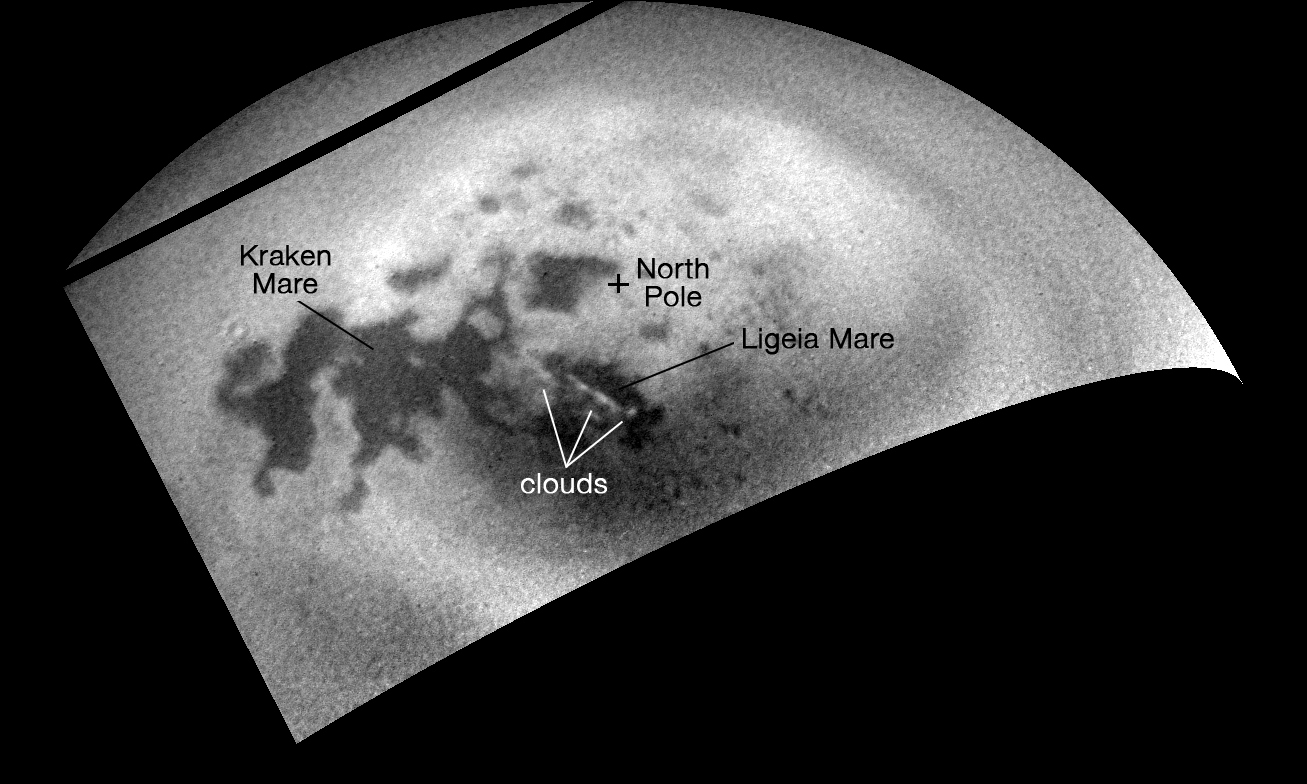
https://photojournal.jpl.nasa.gov/catalog/PIA18421
As NASA’s Cassini spacecraft sped away from Titan following a relatively close flyby, its cameras monitored the moon’s northern polar region, capturing signs of renewed cloud activity.
Cassini scientists noted a decrease in clouds everywhere on Titan after a large storm in 2010, and expected clouds to return sooner, based on computer models of Titan’s atmosphere. Continued monitoring should help them determine if the clouds’ appearance signals the beginning of summer weather patterns, or if it is an isolated occurrence.
A streak of methane clouds is seen here, near center, over the large methane sea known as Ligeia Mare. A movie sequence, PIA18420, shows these clouds in motion over a two-day period.
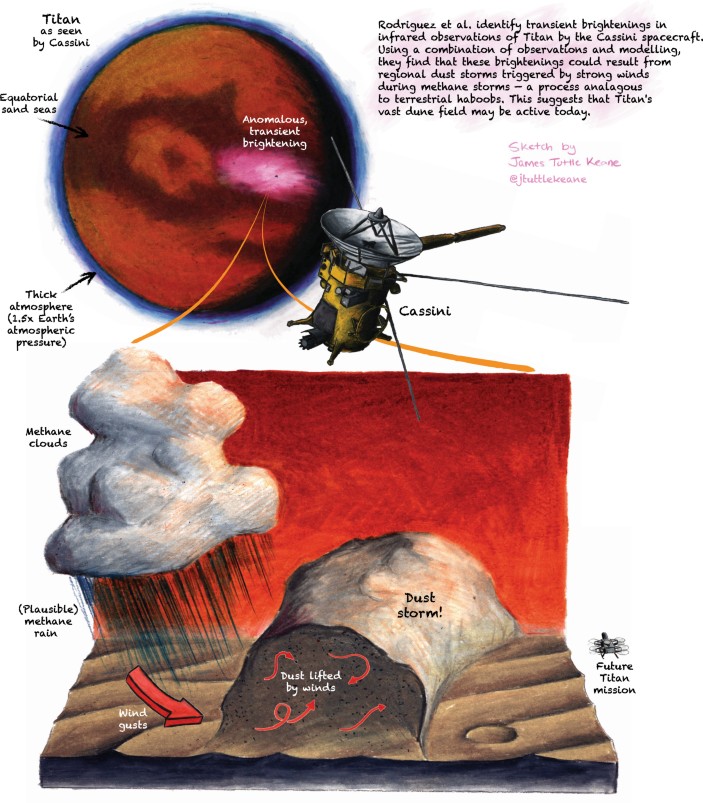
Sand storms #
Article: Observational evidence for active dust storms on Titan at equinox, S. Rodriguez et al, 2018 ( here )
Surface #
The only close-up surface image of Titan, from the Huygens lander (real color for what I know).
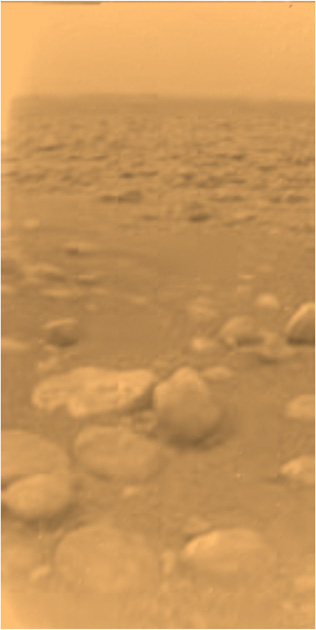
https://photojournal.jpl.nasa.gov/catalog/PIA07232
This image was returned yesterday, January 14, 2005, by the European Space Agency’s Huygens probe during its successful descent to land on Titan. This is the colored view, following processing to add reflection spectra data, and gives a better indication of the actual color of the surface. Initially thought to be rocks or ice blocks, they are more pebble-sized. The two rock-like objects just below the middle of the image are about 15 centimeters (about 6 inches) (left) and 4 centimeters (about 1.5 inches) (center) across respectively, at a distance of about 85 centimeters (about 33 inches) from Huygens. The surface is darker than originally expected, consisting of a mixture of water and hydrocarbon ice. There is also evidence of erosion at the base of these objects, indicating possible fluvial activity.
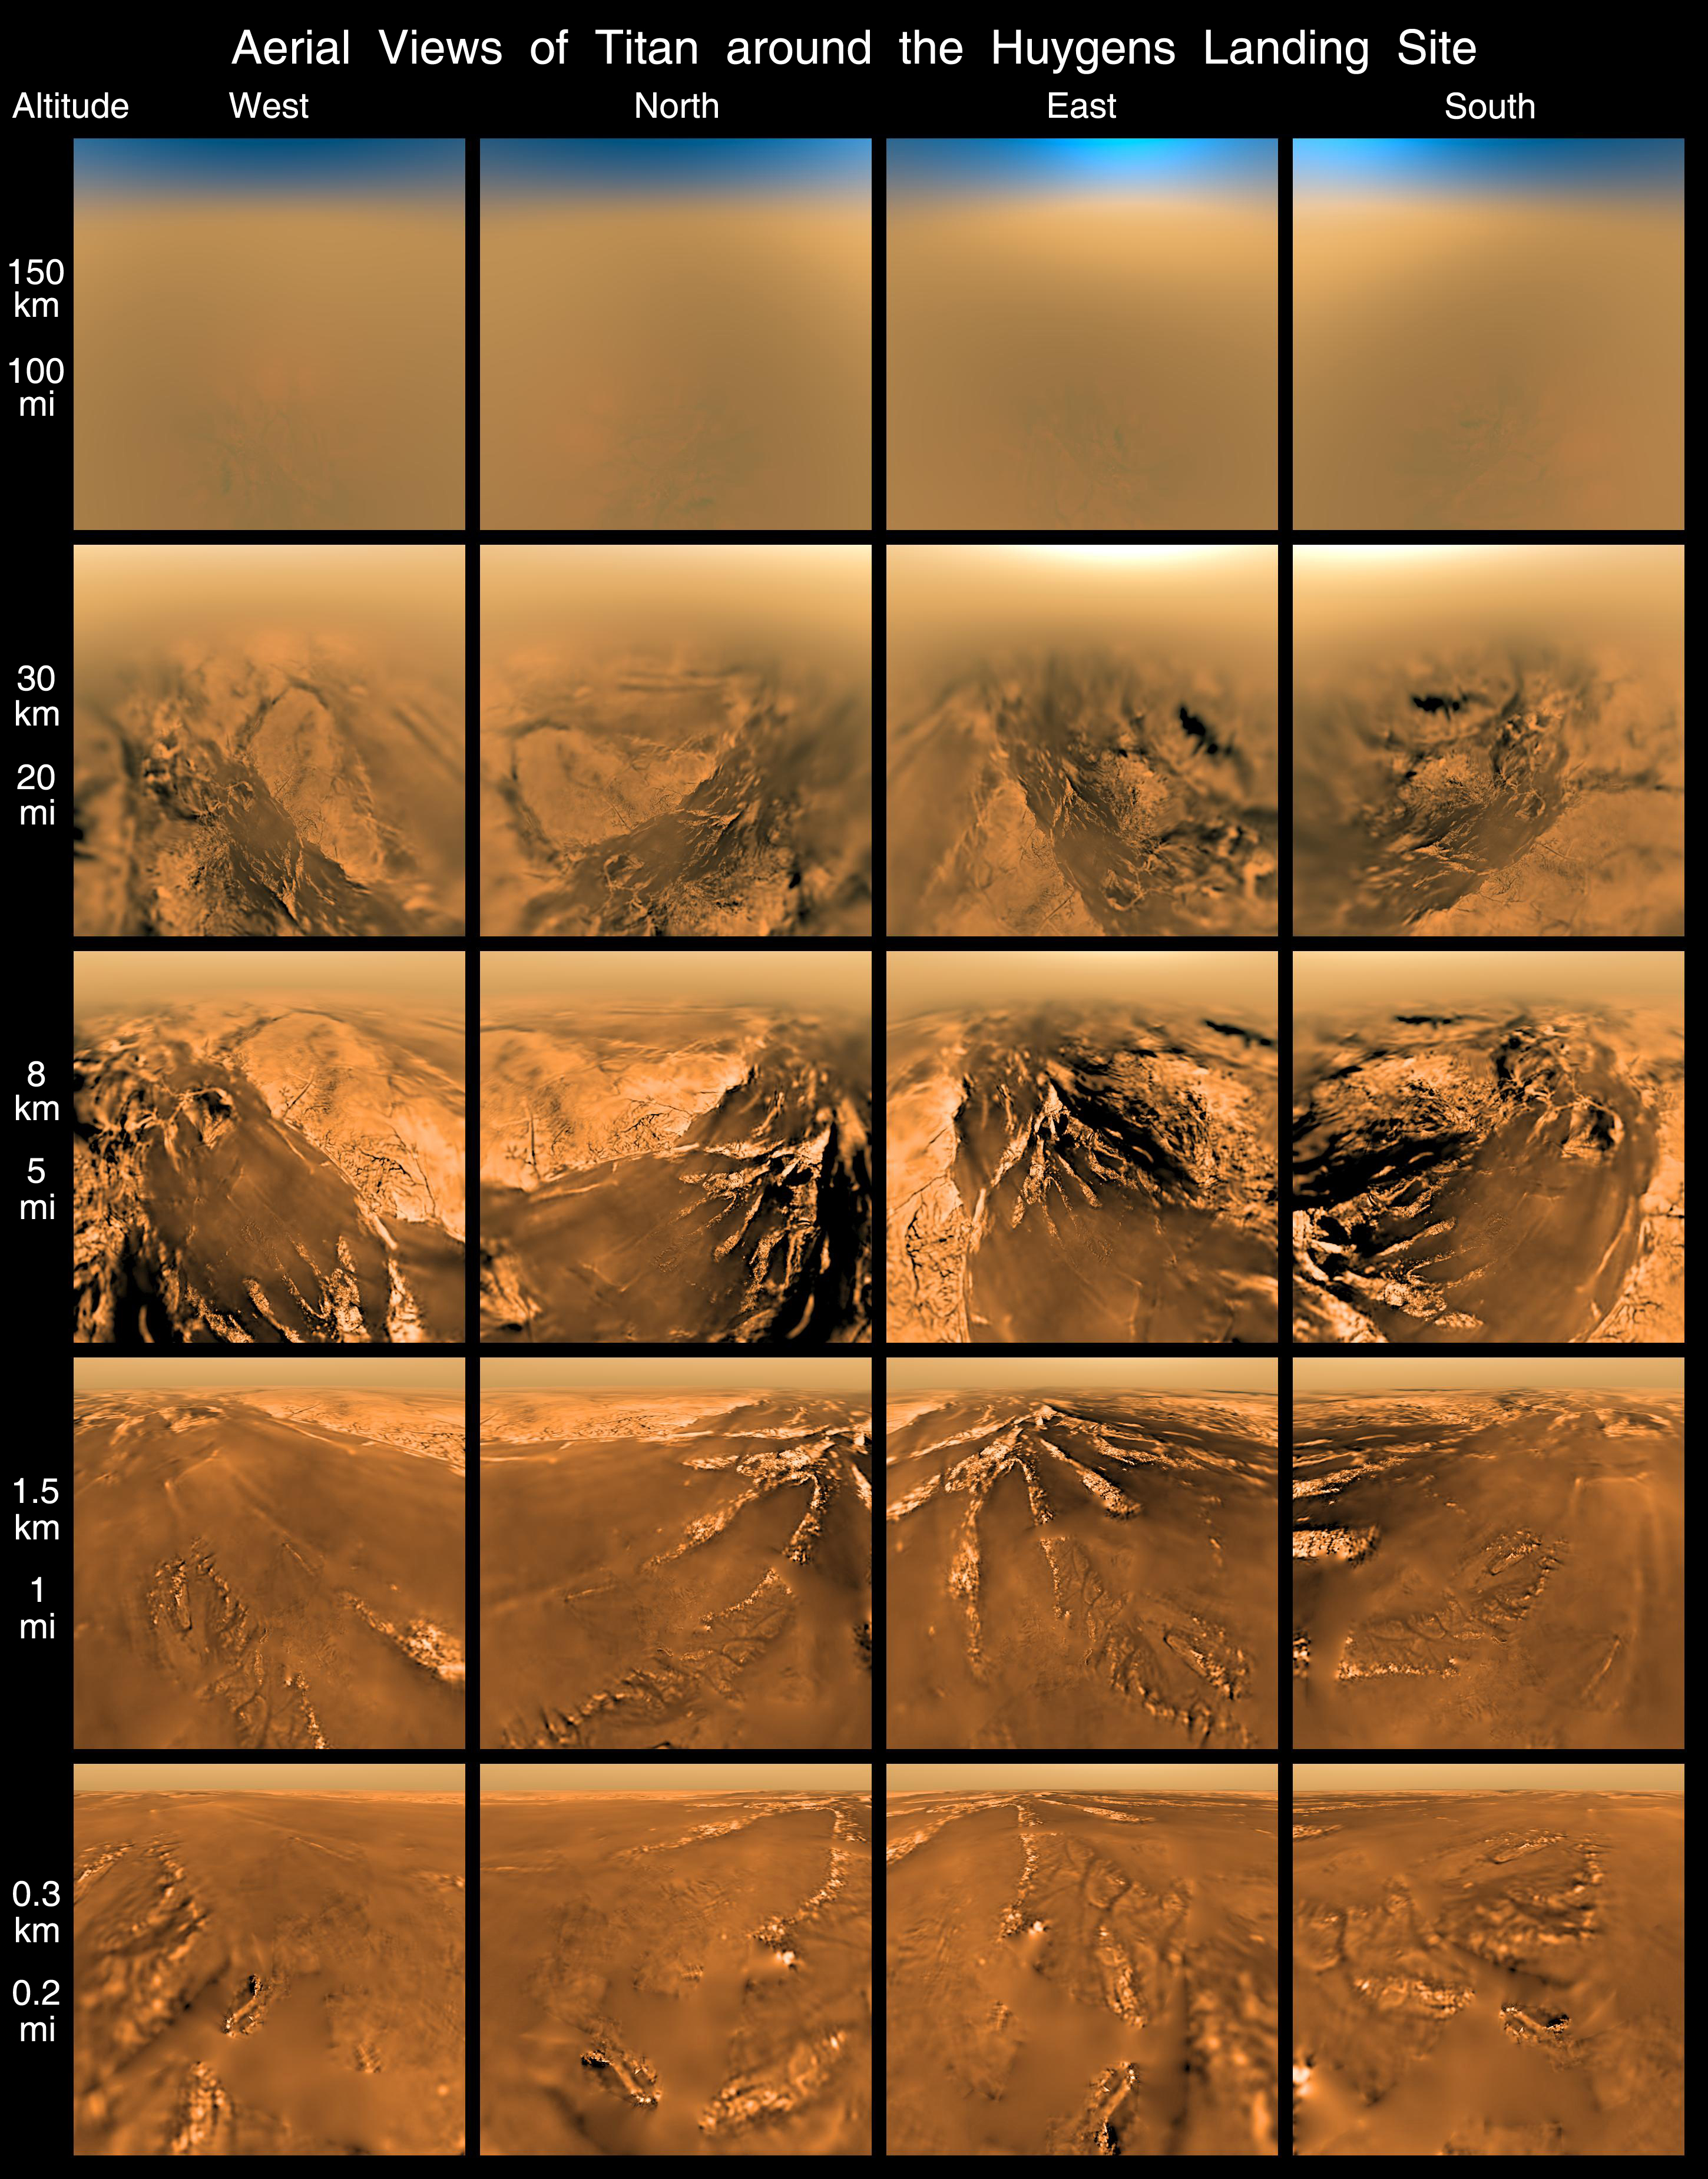
https://photojournal.jpl.nasa.gov/catalog/PIA08119
This poster shows a set of images acquired by the European Space Agency’s Huygens probe descent imager/spectral radiometer, in the four cardinal directions (north, south, east, west), at five different altitudes above Titan’s surface. The images were taken on Jan. 14, 2005.
Lakes #
https://photojournal.jpl.nasa.gov/catalog/PIA20021
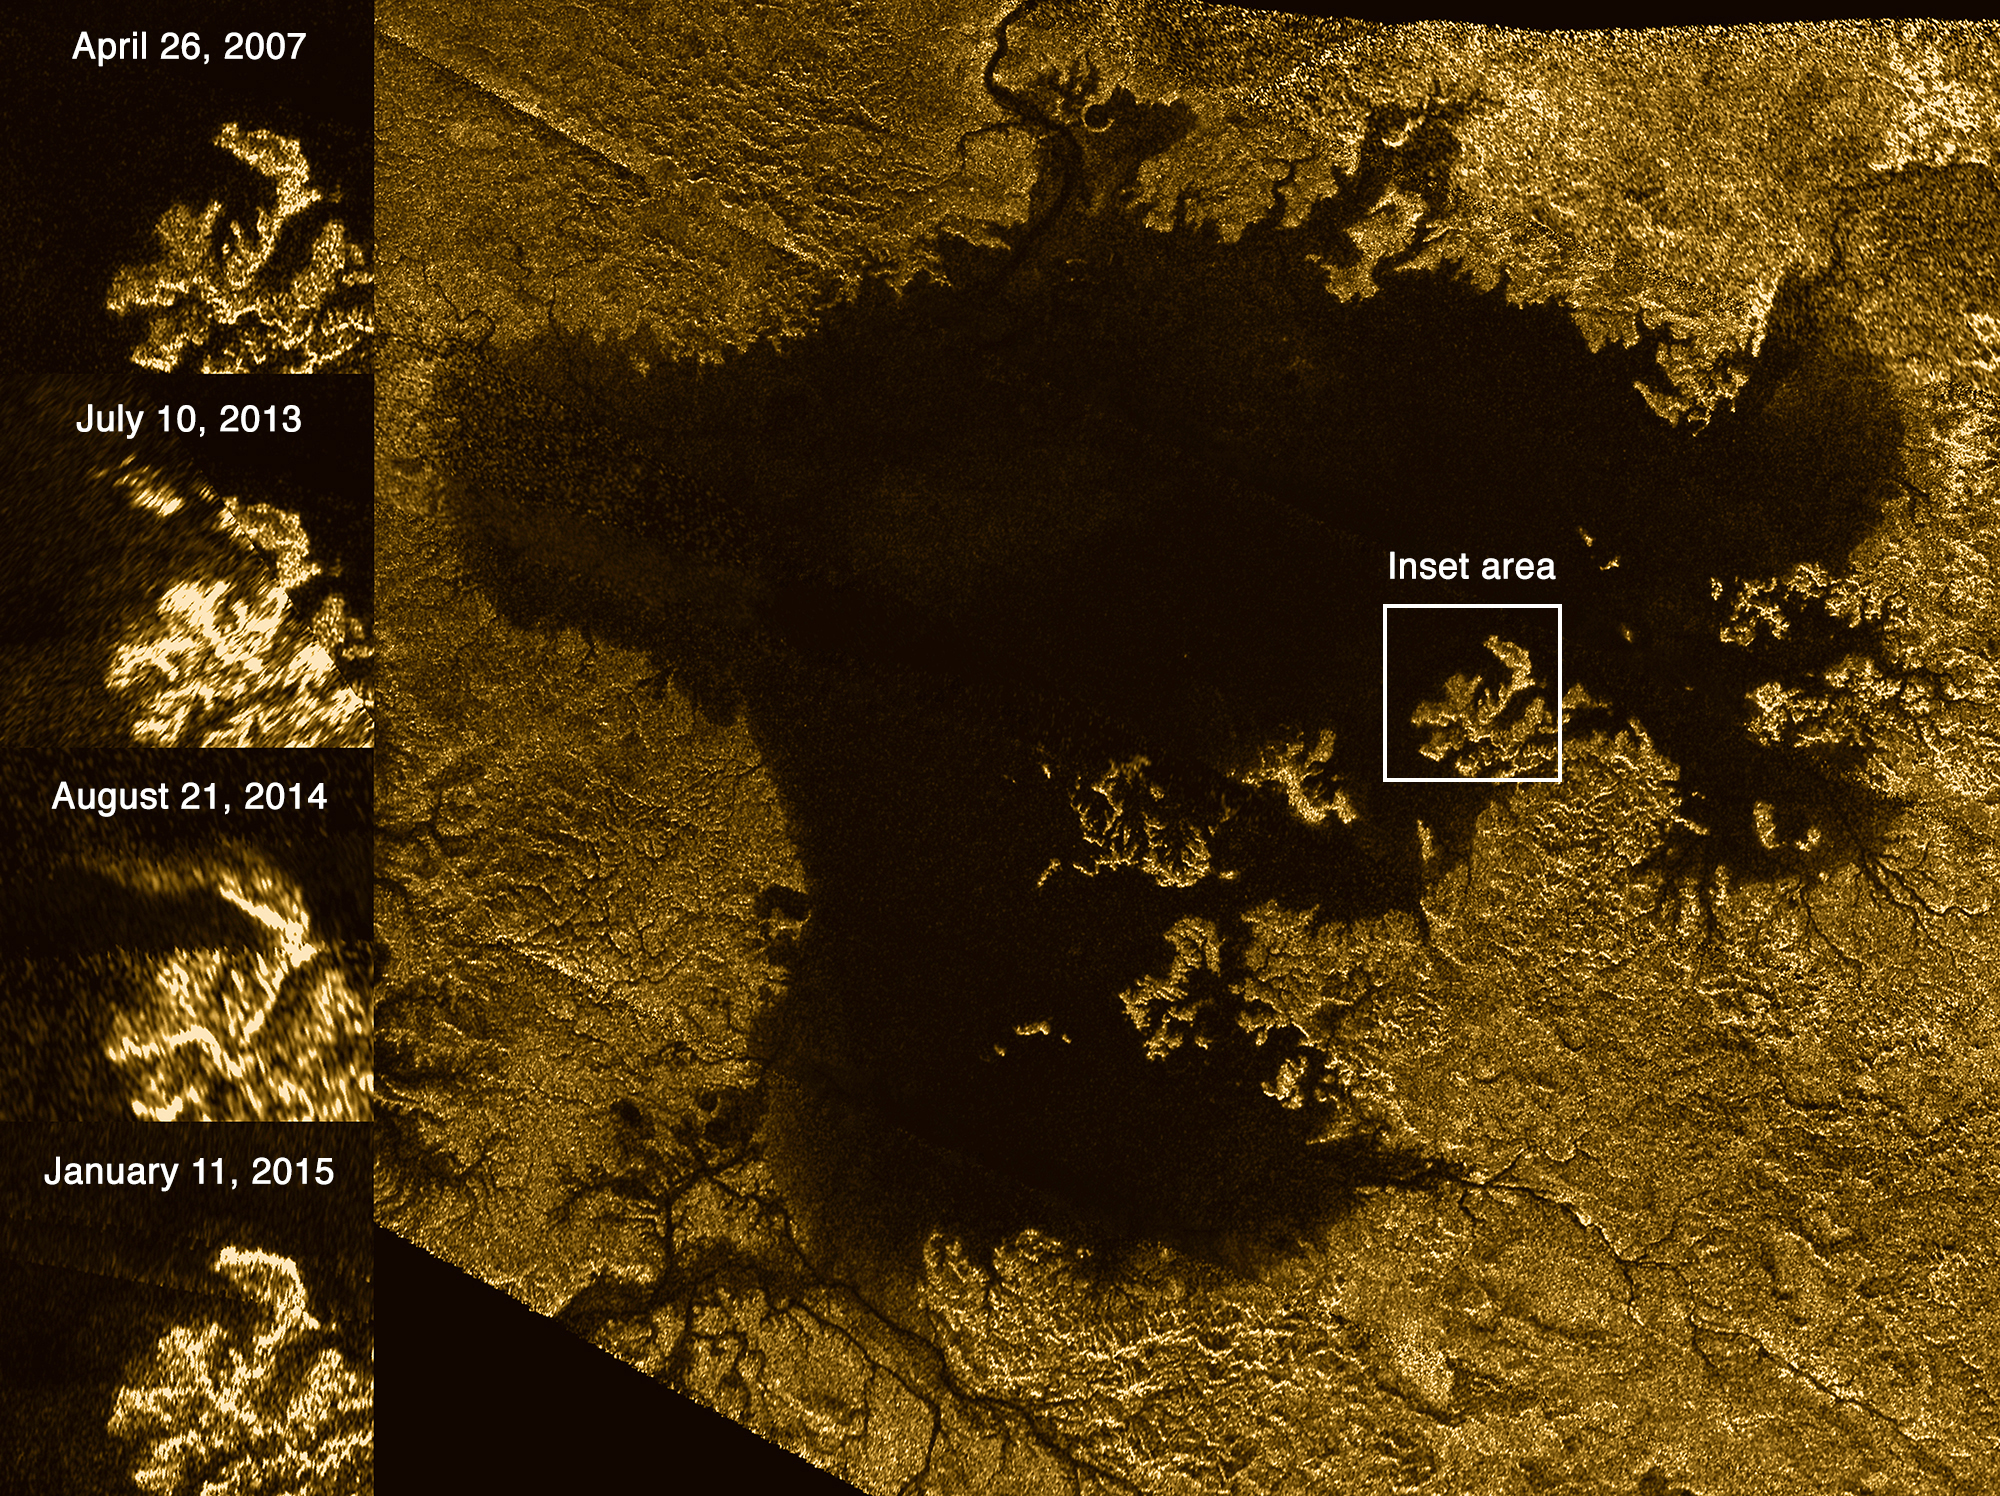
These images from the Radar instrument aboard NASA’s Cassini spacecraft show the evolution of a transient feature in the large hydrocarbon sea named Ligeia Mare on Saturn’s moon Titan. Analysis by Cassini scientists indicates that the bright features, informally known as the "magic island," are a phenomenon that changes over time. They conclude that the brightening is due to either waves, solids at or beneath the surface or bubbles, with waves thought to be the most likely explanation. They think tides, sea level and seafloor changes are unlikely to be responsible for the brightening.
The images in the column at left show the same region of Ligeia Mare as seen by Cassini’s radar during flybys in (from top to bottom) 2007, 2013, 2014 and 2015. The bottom image was acquired by Cassini on Jan. 11, 2015, and adds another snapshot in time as Cassini continues to monitor the ephemeral feature (previously highlighted in PIA18430). The feature is apparent in the images from 2013 and 2014, but it is not present in other images of the region. assini has observed similar transient features elsewhere in Ligeia Mare, and also in Kraken Mare (see PIA19047). These features are the first instances of active processes in Titan’s lakes and seas to be confirmed by multiple detections. Their changing nature demonstrates that Titan’s seas are not stagnant, but rather, dynamic environments.
The Cassini radar team plans to re-observe this particular region of Ligeia Mare one more time during Cassini’s final close flyby of Titan in April 2017. The results may further illuminate the phenomenon responsible for the appearance of the transient features. The large image panel shows Ligeia Mare in its entirety. Ligeia is Titan’s second-largest liquid hydrocarbon sea, and has a total area of about 50,000 square miles (130,000 square kilometers), making it 50 percent larger than Lake Superior on Earth. This panel is a mosaic of five synthetic aperture radar images acquired by Cassini between 2007 and 2014. It shows a region approximately 330 by 305 miles (530 by 490 kilometers) in area.
[…] The images have been colorized and processed for aesthetic appeal.